
Section 1: Get TradingView
TradingView offers the best tools for plotting and tracking stocks, cryptocurrencies, and macro-economic charts. From their website, “What’s TradingView? We’re a charting platform and social network used by 30M+ traders and investors worldwide to spot opportunities across global markets.”
The Rebel Economist is not sponsored nor paid by TradingView for this endorsement. They’re just really good at what they do.
Section 2: Reading Charts
Identifying Support and Resistance
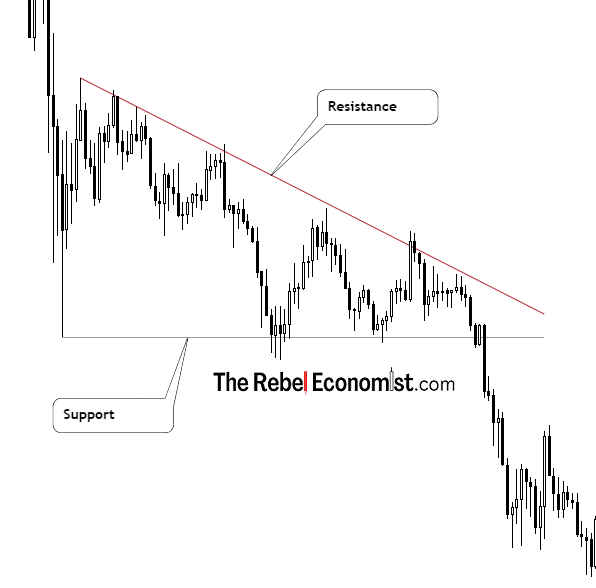
- Resistance Lines are general trendlines where price has difficulty breaking out of. A breakout from these trendlines are generally bullish.
- Support Lines are general trends in which price bounces from. A breakdown of these trendlines are generally bearish.
Resistance and support lines can be drawn in any direction and do not have to match price points exactly – remember, you’re looking for “trends” and this is not an exact science.
Identifying Uptrends
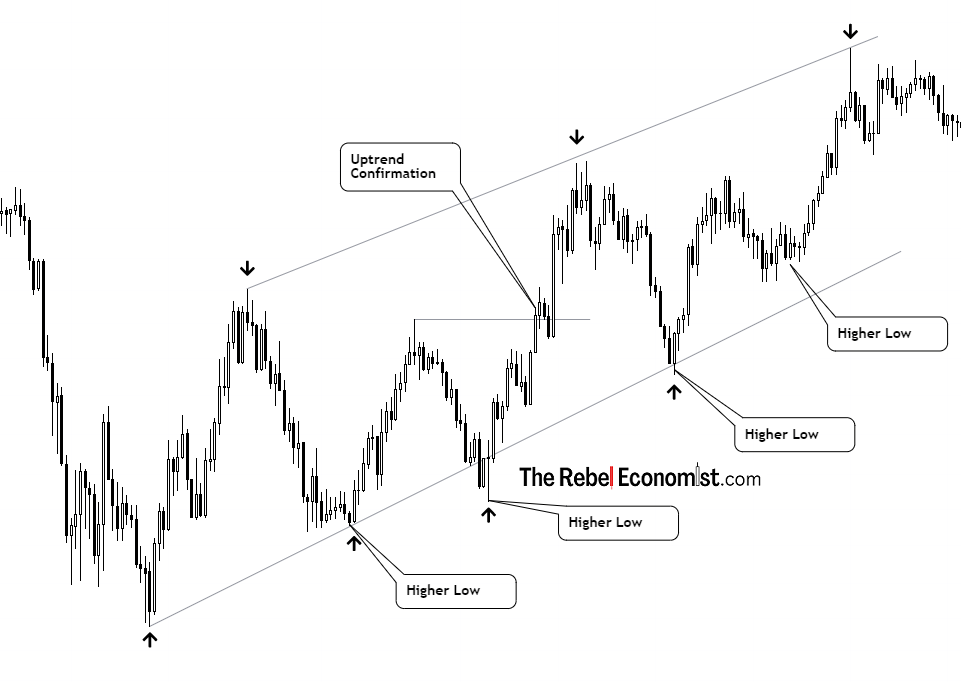
Uptrends generally print higher-lows and higher-highs. One way to confirm an uptrend is if price can breakout from a previous resistance line.
Identifying Downtrends
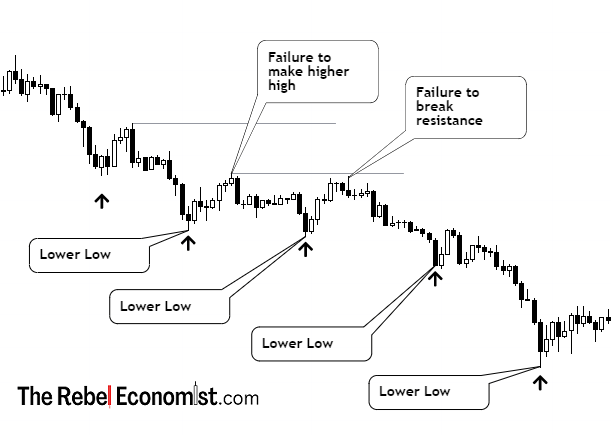
Downtrends print lower-lows and lower-highs and are generally confirmed when a leg up in price fails to beat the resistance line drawn from the previous high.
Regression Lines
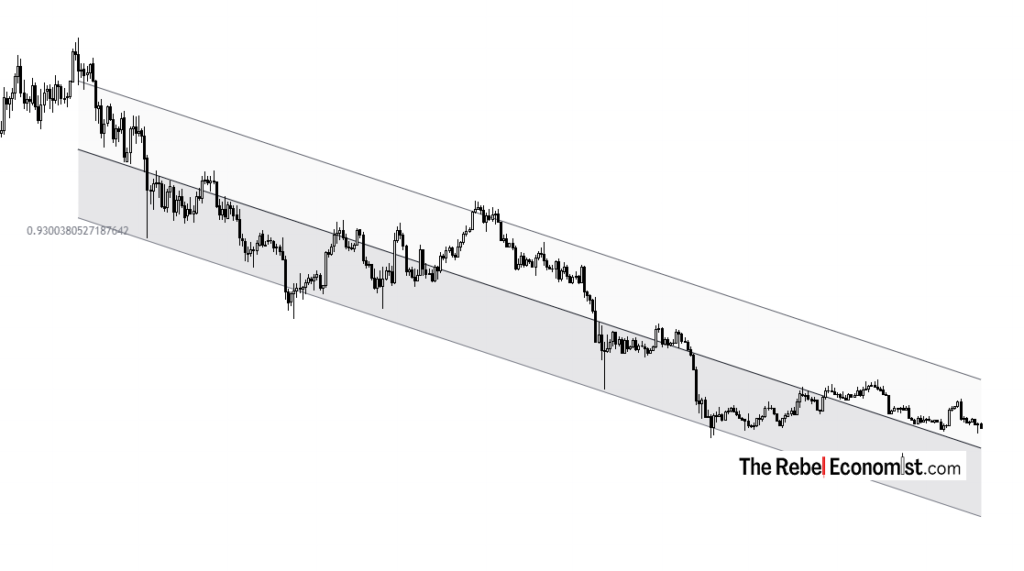
Regression lines are “lines of best fit”. Your chart contains several data points that are plotted on a two-dimensional space. Regression lines look for an “average” between all these points to print a general trend for you.
Candles
Line charts are easy to read, but candle charts print more detail about price action at a given timeframe.
For instance, let’s say you open up a 1-Day chart (meaning, you’re looking at prices from open to close within a 24-hr cycle).
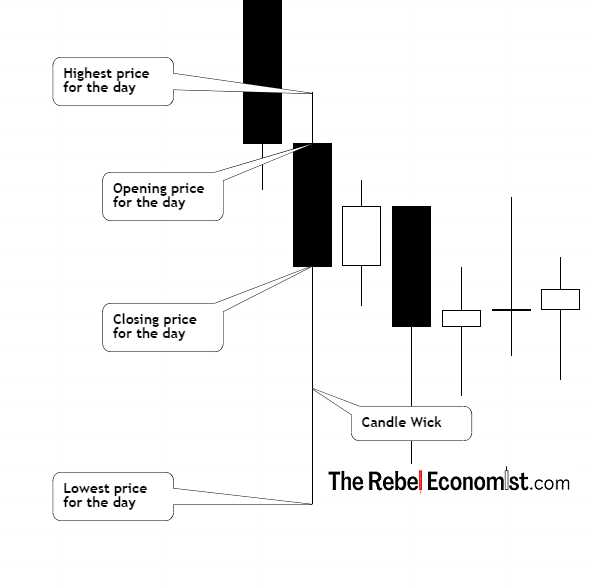
- The body of a candle will give you the prices at open and close of that day.
- The thinner “wicks” at the top and bottom of a candle show you the high and low prices of that day.
- Black (or red) candles mean the price finished lower than the close of the previous day.
- White (or green) candles mean the price finished higher than the close of the previous day.
Indicators
Relative Strength Index
The RSI or “relative strength index” quite literally measures the ‘strength’ of price ‘relative’ to the previous 14 time units/periods on an index scaled 0 to 100.
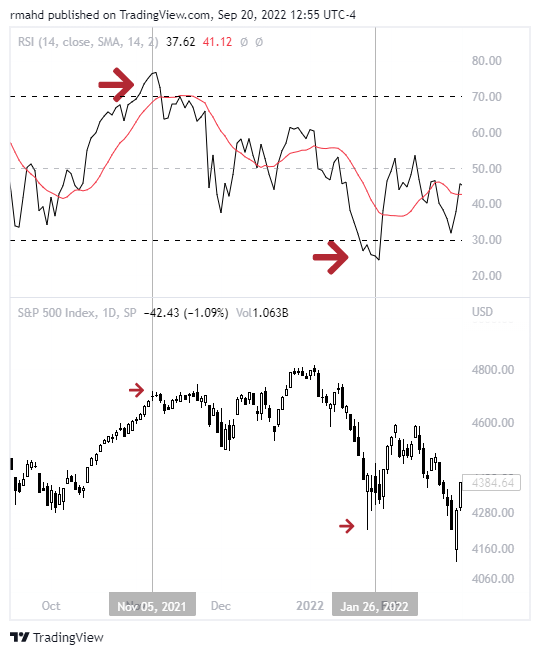
The price strength thresholds are as follows:
- Index below 30 = oversold
- Index above 70 = overbought
The RSI can be used to find buy and sell signals for entries and exits on a particular asset.